On-time performance
Measure pickups and appointment arrivals against their windows, broken down by driver, facility, and time of day.
Reporting & analytics
You can't fix what you can't see. Axen turns the trip data your team already creates—schedules, statuses, GPS miles, billing activity—into reports that show where service, efficiency, and revenue are won or lost.
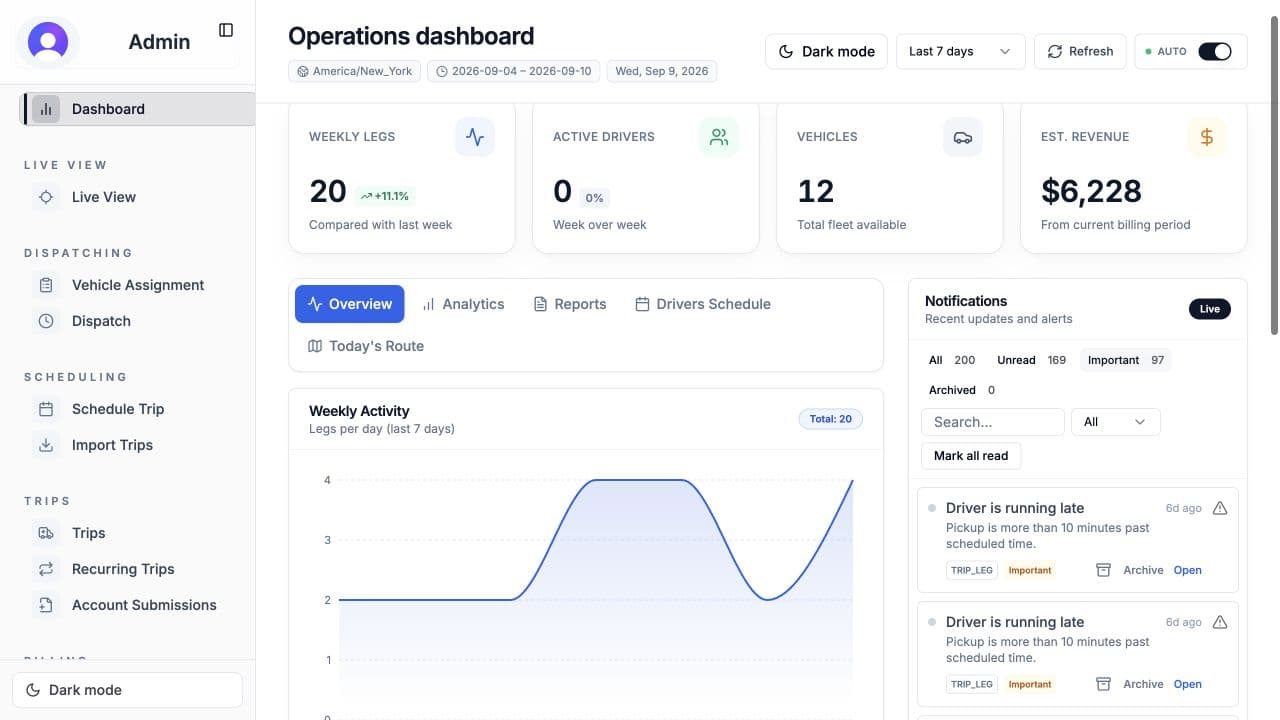
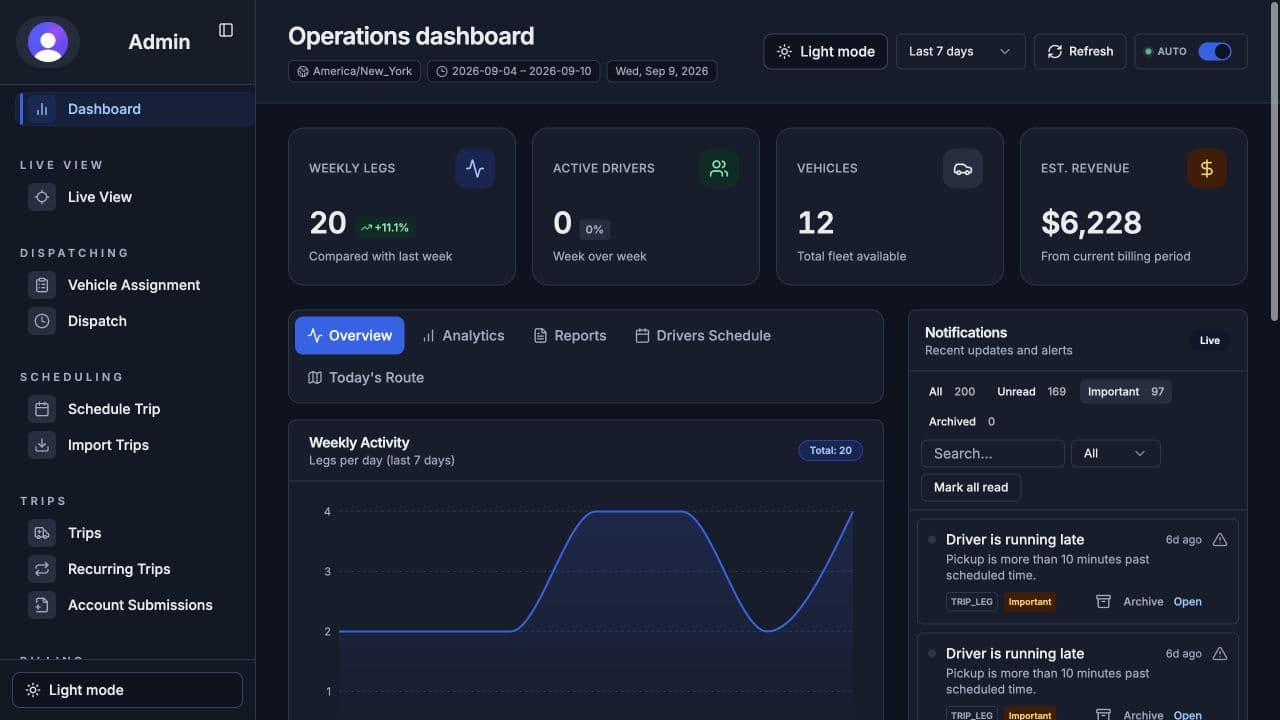
Measure pickups and appointment arrivals against their windows, broken down by driver, facility, and time of day.
Compare loaded, empty, and total miles per vehicle to find where capacity is wasted and where routes break down.
See trips per shift, dwell times, and status timeliness so coaching conversations start from data, not anecdotes.
Track billed versus paid amounts, exception rates, and unbilled completed trips before they age out.
Understand trip volume by day, payer, and service area to plan staffing, vehicles, and growth.
Share operational summaries with owners, brokers, or facility partners without rebuilding spreadsheets by hand.
A report is only useful if it changes what you do Monday morning. Some examples of how NEMT teams use this data: a fleet manager sees one route consistently running 20 minutes late and discovers the facility's posted dwell time is wrong; an owner sees trips per vehicle falling on Thursdays and adjusts driver scheduling; a billing lead finds completed trips sitting unbilled for a week and adds a daily review step.
Because reporting sits on the same records as dispatch, GPS tracking, and billing, the numbers reconcile—there is no separate “reporting spreadsheet” drifting away from reality.
For definitions and benchmark-setting guidance, read NEMT KPIs providers should track and how to reduce dead miles.
Most providers start with on-time performance, dead-mile percentage, trips per vehicle per day, completed-but-unbilled trips, and denial rate. Together these cover service quality, efficiency, and cash flow.
From the operation itself: scheduled trips, driver app statuses, GPS mileage, and billing activity. Because Axen connects those workflows, reporting reflects what actually happened rather than manual re-entry.
Yes. Planned routes and times can be compared with GPS-recorded actuals, which is how teams find systematic issues like an underestimated facility dwell time.
Reports can be exported for sharing. The formats your brokers require can be reviewed during a demo.
We'll walk through the reports that match the questions you're trying to answer.
Schedule a demo